Graphs | Charts | Diagrams
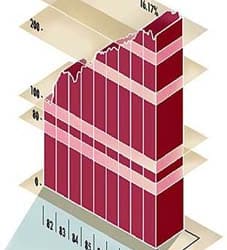
Financial Report Graph
This financial report graph was done in Adobe Illustrator for a Chicago-based financial institution annual report.
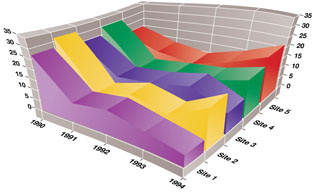
Financial Growth Graph
This financial growth graph was done in Adobe Illustrator for a Chicago-based financial institution annual report.

Business Solution Map
This hand-drawn sketch was done with sepia Sharpie markers on white tracing paper, as part of a business architecture consulting project for a major healthcare insurance provider. Laster, these sketches were turned into Adobe Illustrator digital diagram artwork....

1997 Black Book Ad
Randal Birkey put together this self-promotional ad for the 1997 Black Book. It features: Pharmaceutical Product Logo Globe - Product Illustration Retouched and digitally altered 5 dollar bill with 2 Abe Lincoln's Close-up diagram of a chain product used in a road...

1998 Black Book Ad
Randal Birkey put together this self-promotional ad for the 1998 Black Book. It features: A series of vector line art icons A Nuclear Fission Reactor Core Vessel An Atomic Level Fission Nuclear Reaction Diagram A Medical Doctor Digital Vector Illustration Youth...

Ameritech “Signals” Magazine
Randal did this vector digital illustration in Adobe Illustrator for Ameritech's "Signals" magazine in the 1980's. It demonstrates how their wireless technology can penetrate walls and windows in buildings giving customers better cell signal reception.

Network Architecture Diagram
Seems like I am always making these little sketches to show people I am talking with, some of the ideas and concepts behind the type of websites we build at BIRKEY.COM. I made this sketch recently when explaining the difference between a typical classic Microsoft...